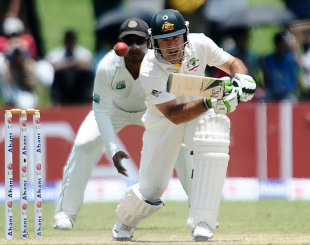
Ricky Ponting's 100th Test victory
The winning machine
Only three other players have won more than 75 Tests, which puts Ricky Ponting's record into perspective
September 3, 2011
Text size: A | A
| |||
Related Links | |||
For most players, playing 100 Test matches is a huge achievement - only 50 have achieved it in the history of Test cricket. However, with this victory against Sri Lanka in Galle, Ricky Ponting became the first player to be a part of 100 Test victories. It's a huge achievement, and a telling commentary on the quality of the player and the team he has been a part of.
Only three other players have won more than 75 Tests, an indication of just how difficult it is to reach the landmark. The top seven players with most winsare all Australians who were an intrinsic part of the dominant team of the 1990s and 2000s - the first non-Australian in the list is Mark Boucher, with 70 victories. He is also the first active player in the list after Ponting, with team-mate Jacques Kallis following closely on 69. With 30 wins needed to get to a century, though, it's almost certain that neither will get to that mark, which means Ponting will be the lone member of this club for a while.
Only Australians and South Africans are represented in the table below, so here's a look at the players who've been a part of the most wins for the other major countries - Viv Richards (63), Sachin Tendulkar (61), Muttiah Muralitharan (54), Inzamam-ul-Haq (49), Andrew Strauss (44), Stephen Fleming (33). It also puts Ponting's record in perspective to see that no player from three of the top teams - Pakistan, England and New Zealand - has managed to reach the 50-win landmark.
| Batsman | Test wins | Total Tests | Percentage |
| Ricky Ponting | 100 | 153 | 65.36 |
| Shane Warne | 92 | 145 | 63.45 |
| Steve Waugh | 86 | 168 | 51.19 |
| Glenn McGrath | 84 | 124 | 67.74 |
| Adam Gilchrist | 73 | 96 | 76.04 |
| Mark Waugh | 72 | 128 | 56.25 |
| Matthew Hayden | 71 | 103 | 68.93 |
| Mark Boucher | 70 | 139 | 50.36 |
| Justin Langer | 70 | 105 | 66.67 |
| Jacques Kallis | 69 | 145 | 47.59 |
Of Ponting's 100 wins, a fifth has come against England, but that's also because he has played 35 Tests against them, which works out to 23% of his total Tests. In fact, Ponting's record against England is a bit odd: his overall average against them is 44.21, and in wins it goes up slightly - but still not to his usual levels - of 48.20. In England, though, his average in wins goes down to 32.71, though that also includes two wins against Pakistan in England. His average in defeats in England is 40.85, and in draws it's 65.16.
Overall, his average in wins against most teams isn't that much higher than his overall average against them, but the one exception is his stats against India - an average of 47.88 overall, and 74.20 in wins.
| Versus | Tests | Runs | Average | 100s/ 50s | Overall ave |
| England | 20 | 1446 | 48.20 | 5/ 5 | 44.21 |
| West Indies | 18 | 1546 | 61.84 | 6/ 5 | 59.06 |
| South Africa | 14 | 1353 | 61.50 | 6/ 6 | 56.38 |
| Pakistan | 13 | 1346 | 67.30 | 5/ 4 | 66.82 |
| New Zealand | 10 | 713 | 59.41 | 1/ 5 | 57.47 |
| Sri Lanka | 9 | 579 | 41.35 | 0/ 5 | 47.31 |
| India | 8 | 742 | 74.20 | 3/ 2 | 47.88 |
| Bangladesh | 4 | 260 | 65.00 | 1/ 2 | 65.00 |
| Zimbabwe | 3 | 290 | 96.67 | 1/ 1 | 96.67 |
| ICC World XI | 1 | 100 | 50.00 | 0/ 1 | 50.00 |
In the first three years of his career, Ponting wasn't such a force with the bat, averaging only 36.63 in 22 Tests during that period, and 39.00 in wins. Happily for him, his most prolific period with the bat coincided with the best period for Australia as a Test team, when they had a power-packed batting line-up, a strong pace attack, and a wizard for a spinner. With all bases covered, Australia won Tests everywhere they went, and Ponting contributed heavily in those matches. Out of 87 matches that Ponting played between 1999 and 2006, Australia won 64, which is almost 74%. His average in those wins was a staggering 71.63, and he scored 25 centuries in those 64 games - an average of a ton every 2.56 Tests.
His loss of batting form, though, has coincided with a dip in Australia's fortunes - they've lost many of their heavyweights, and consequently the results have dipped as well. In the last 44 Tests that Ponting has played, Australia have won barely over 50%, and Ponting's average in those wins has dipped to around 40.00. In these 23 wins he has scored only two hundreds, a huge drop from 25 in 64.
| Period | Tes Wins | Runs | Average | 100s/ 50s | Overall Tests | Overall ave |
| Till Dec 1998 | 13 | 703 | 39.05 | 1/ 5 | 22 | 36.63 |
| Jan 1999 to Dec 2006 | 64 | 6161 | 71.63 | 25/ 20 | 87 | 65.43 |
| Jan 2007 onwards | 23 | 1511 | 39.76 | 2/ 11 | 44 | 40.63 |
| Career | 100 | 8375 | 58.97 | 28/ 36 | 153 | 53.26 |
Only six batsmen have scored more than 5000 runs in Test wins, of which four are Australians. Ponting's tally of 8375 runs is easily the highest among them, but in terms of the tally as a percentage of career runs, a couple of Australians have a slightly higher number: Matthew Hayden scored 71% of his total Test runs in wins, while for Justin Langer that percentage was almost 68. Ponting scored 67.48% of his total runs in wins, which is much higher than the percentages for non-Australian batsmen. Tendulkar has scored less than 37% of his total runs in wins, which is an indication of much tougher it's been for India to win Test matches. (Till the end of 2000, only 24% of Tendulkar's runs came in wins; since then, with India improving as a Test team, it's gone up to 46%.)
| Batsman | Tests | Runs | Average | 100s/ 50s | Total runs | % runs in wins |
| Ricky Ponting | 100 | 8375 | 58.97 | 28/ 36 | 12,411 | 67.48 |
| Steve Waugh | 86 | 6460 | 69.46 | 25/ 25 | 10,927 | 59.12 |
| Matthew Hayden | 71 | 6154 | 55.44 | 23/ 19 | 8625 | 71.35 |
| Jacques Kallis | 69 | 5591 | 65.01 | 19/ 26 | 11,947 | 46.80 |
| Sachin Tendulkar | 61 | 5473 | 67.56 | 20/ 21 | 14,965 | 36.57 |
| Justin Langer | 70 | 5229 | 48.41 | 15/ 19 | 7696 | 67.94 |
However, with Australia being such a strong side with so many match-winners, they weren't as reliant on Ponting to score runs and set up wins as some of the teams with slightly weaker batting line-ups. Ponting contributed about 15% of the total runs scored off the bat in the 100 Tests that Australia won. For Kallis and Tendulkar, the percentage is around 16.50; for Rahul Dravid, who just misses out on the 5000-run cut-off (click here for the full list of highest run-scorers in wins) the percentage is 16.99, just a tad higher than Tendulkar's; for Don Bradman, it's 28.25% (4813 runs out of 17036), which puts some of the other numbers in perspective.
| Batsman | Runs in wins | Team runs in wins | Percentage |
| Ricky Ponting | 8375 | 55,743 | 15.02 |
| Steve Waugh | 6460 | 45,691 | 14.14 |
| Matthew Hayden | 6154 | 39,634 | 15.53 |
| Jacques Kallis | 5591 | 33,737 | 16.57 |
| Sachin Tendulkar | 5473 | 32,908 | 16.63 |
| Justin Langer | 5229 | 38,375 | 13.63 |
And finally, a look at the players with the highest win percentages among those with at least 50 Test victories. Only 22 players make the cut, of which 12 are Australians. And when ranked by win percentages, the top eight are Australians, with Gordon Greenidge and Richards rounding off the top ten.
In this table, Ponting only comes in in sixth place - there are five Australians who have a higher win percentage. Ponting's loss percentage among these ten is second only to Mark Waugh's, no doubt because of the defeats suffered over the last couple of years. Adam Gilchrist's numbers are incredible because of the exceptionally low number of defeats and draws. In the last two rows, the number that stands out the most for Greenidge and Richards is the draw percentage - it's much higher than for all the Australians, which indicates the manner in which Australia have played Tests over the last 15 years, and the way Test cricket itself has changed in the last couple of decades.
| Player | Tests | W/L/D | Win % | Loss % | Draw % |
| Adam Gilchrist | 96 | 73/11/12 | 76.04 | 11.46 | 12.50 |
| Brett Lee | 76 | 54/11/11 | 71.05 | 14.47 | 14.47 |
| Matthew Hayden | 103 | 71/18/14 | 68.93 | 17.48 | 13.59 |
| Glenn McGrath | 124 | 84/20/20 | 67.74 | 16.13 | 16.13 |
| Justin Langer | 105 | 70/17/18 | 66.67 | 16.19 | 17.14 |
| Ricky Ponting | 153 | 100/28/25 | 65.36 | 18.30 | 16.34 |
| Shane Warne | 145 | 92/26/27 | 63.44 | 17.93 | 18.62 |
| Mark Waugh | 128 | 72/27/29 | 56.25 | 21.09 | 22.65 |
| Gordon Greenidge | 108 | 57/14/37 | 52.78 | 12.96 | 34.26 |
| Viv Richards | 121 | 63/19/39 | 52.07 | 15.70 | 32.23 |
S Rajesh is stats editor of ESPNcricinfo
© ESPN EMEA Ltd.
Sorry for Sachin Tendulkar
ReplyDelete